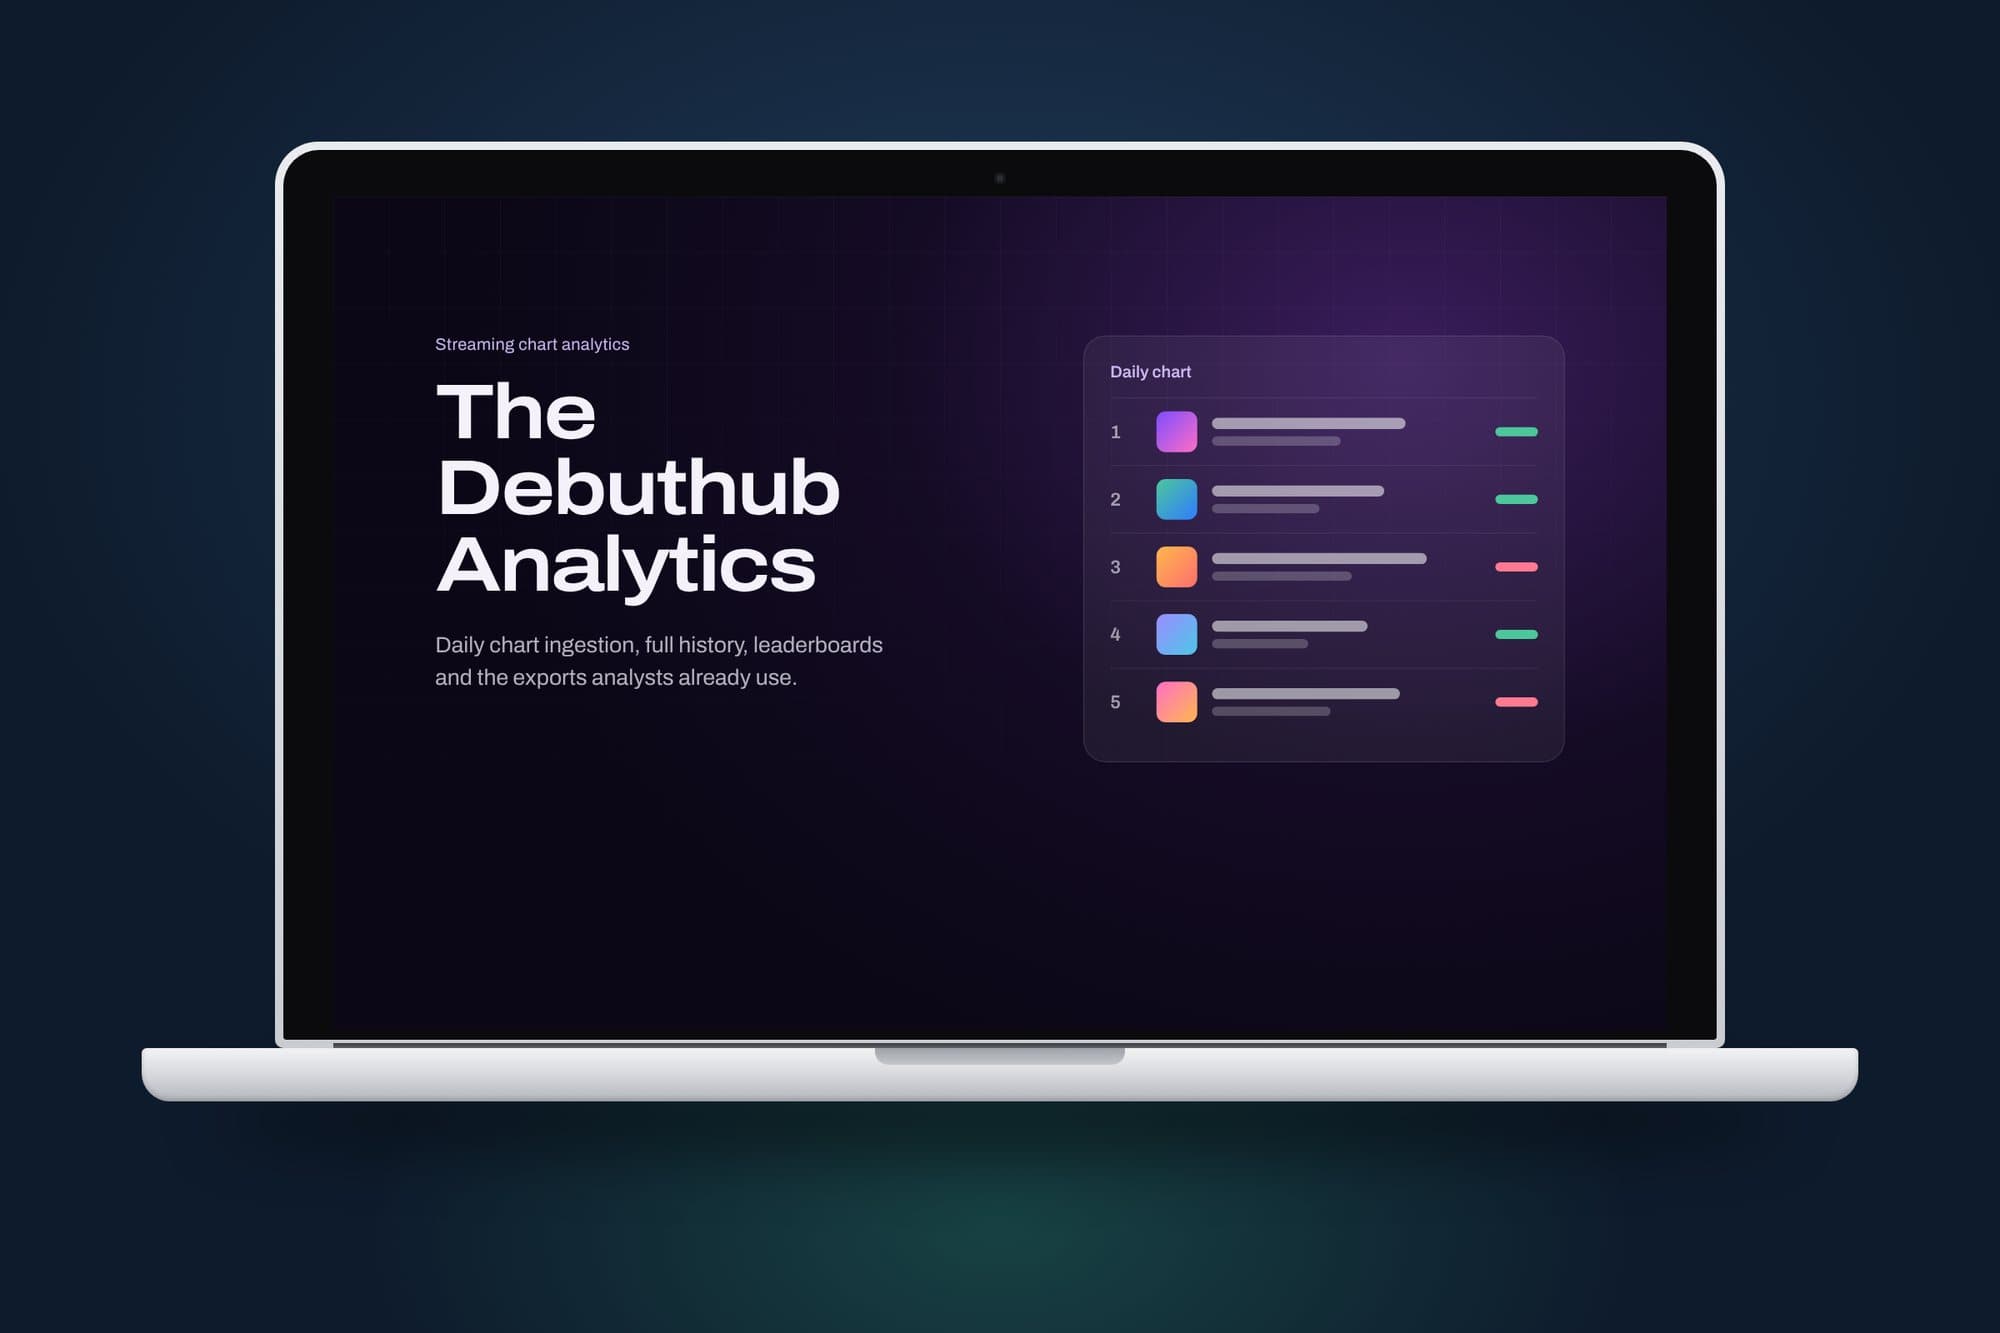
A streaming chart analytics platform that collects a regional top 200 chart every day, keeps the full history and exports the reports analysts already use.
- Client
- Debut Hub
- Sector
- Entertainment
The brief
Debut Hub's analysts tracked a regional streaming chart by hand, copying it into spreadsheets every day. History was patchy, and every report took hours to rebuild.
What was built
- Daily collection: a scheduled job pulls the chart every day (rank, track, artists, label, plays, previous rank and status) and keeps the full history.
- One catalogue: artists, tracks and labels stored once and linked to each streaming source, so new sources can be added later without changing the model.
- Dashboard: headline figures, today's number one, climbers, new entries, trends over time and a page for every artist, track and label.
- Exports: a spreadsheet export on every view, in the exact sixteen column layout the analysts already used, with peak position, days on chart and rank history worked out on the server.
- Security: credentials encrypted at rest, raw data archived to object storage, and the daily run driven by Cloud Scheduler.
The platform is private, so this page keeps the details light.
Stack
| Area | Tools |
|---|---|
| Backend | Python, Django, Django REST Framework, PostgreSQL, django-unfold |
| Data collection | openpyxl, requests, Playwright, Fernet encryption |
| Infrastructure | Google Cloud: Cloud Run, Cloud SQL, Cloud Storage, Cloud Scheduler, Secret Manager |